I have two 128 GB unified-memory machines on my desk. Day job gear, not mine. One is an ASUS Ascent GX10 — an NVIDIA GB10 Grace Blackwell appliance half the size of a hardback book. The other is an HP ZBook Ultra G1a, a 14" mobile workstation running AMD’s Ryzen AI MAX+ PRO 395 (“Strix Halo”). Both hold an 80B coding model entirely in memory. How do they compare for agentic coding?
I wanted very badly for the laptop to be good enough. Partly for selfish reasons — a laptop that serves its own coding agent on an airplane is a genuinely different life than a laptop that phones home to a box in the office! But my experience these past few months made me wonder if I was using it incorrectly… and wondering if the AMD ROCm stack was up to the task.
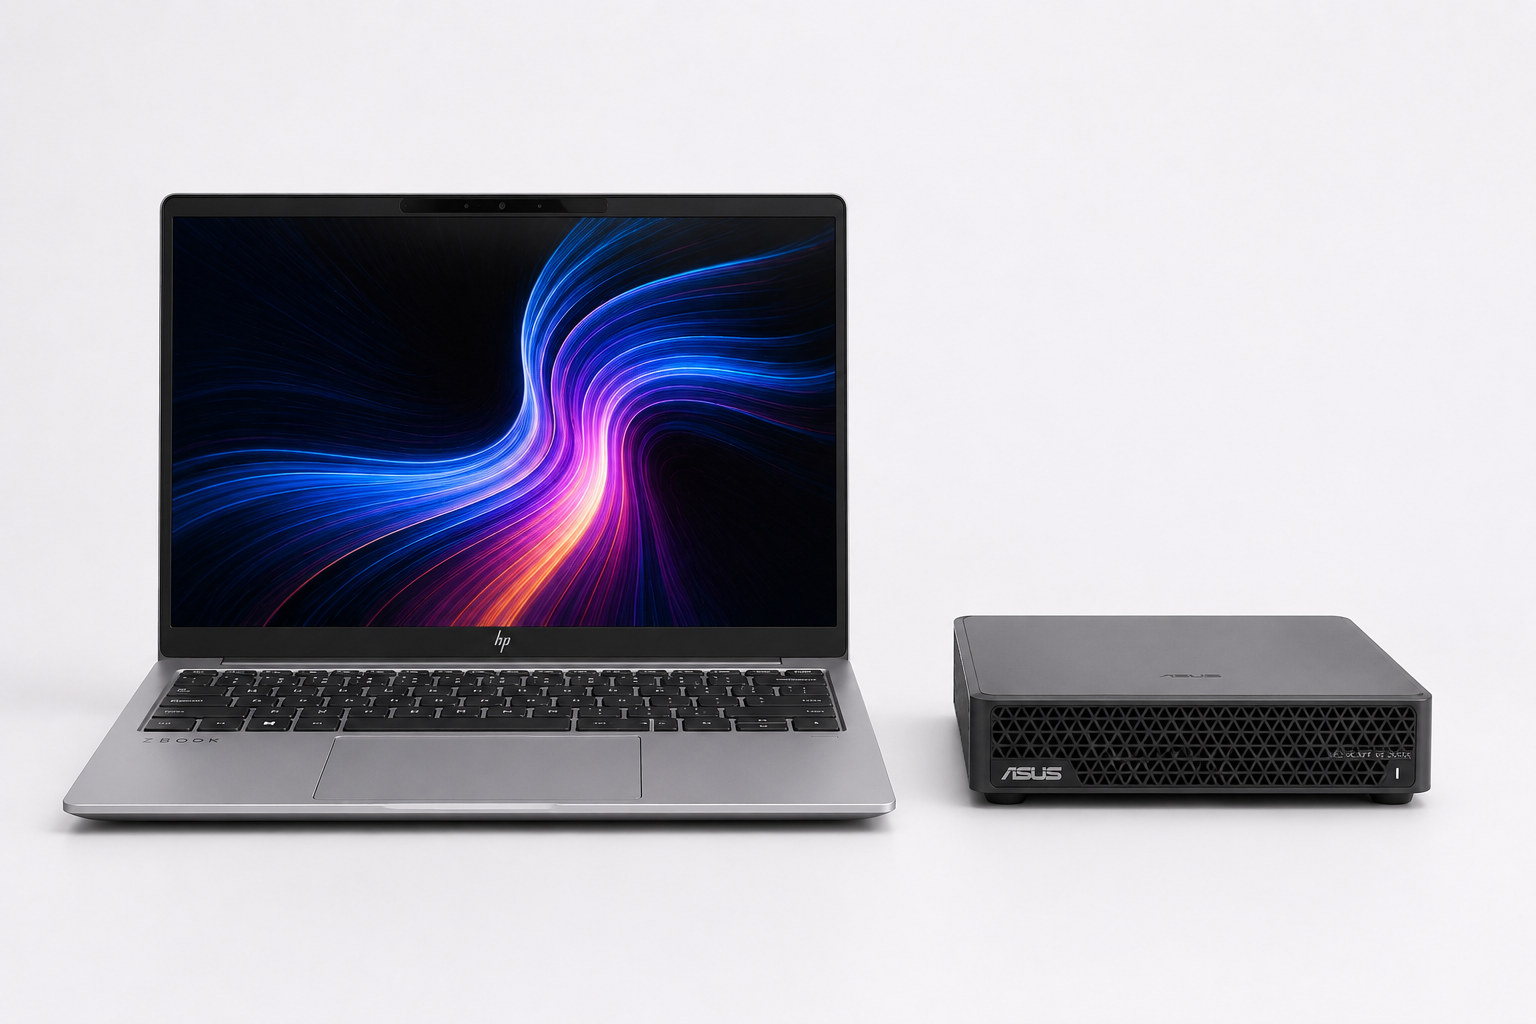
Both of these hold the same 80B model in memory. The little one serves it 1.71× faster.
So I actually tested it. 27 trials, one frozen task, one frozen grading suite. The repo and results are here.
The short version: the code they produce is indistinguishable. The GB10 is 1.71× faster per token, and closer to 4× on the part you actually sit and wait for. Under the one time cap I gave both machines, the GB10 finished on its own 5 runs out of 6. The laptop finished none out of 5.
That second number looks damning, and mostly it isn’t. Working out why it isn’t is the most useful thing I got out of this whole exercise — and it required me to take my own measurement apart in public, which is what most of this post turned into. Come for the benchmark, stay for the autopsy.
Because the thing I actually care about isn’t tokens per second. Waiting is an annoyance. Coming back to a job that quit — or that has been sitting there for an hour waiting to ask you a question — is what actually costs you the afternoon.
Why I Bothered
Agentic coding is, by a wide margin, the most token-hungry thing I do. Chat is nothing next to it. An agent that reads files, runs a build, reads the failure, edits, and runs it again burns tokens in a way that makes an interactive conversation look free — and it does it unsupervised, at machine speed, while you go get coffee. Or sleep.
Back in May I wrote that AI inference costs are the wake-up call for 2026 and 2027 — Anthropic ending fixed enterprise pricing, Copilot going usage-based, and every budget built on fixed-fee assumptions quietly becoming wrong. I closed that post with a section called “The Case for Local Inference” and a promise to dig into it later.
This is me digging into it. Hi. It took a while.
In July I followed that up with the vocabulary I think makes this land in a budget meeting: tokens should be NRE, not COGS. Spend in the COGS column and you buy one cut, at the same price, forever. Spend in the NRE column and you buy a jig — expensive once, then nearly free.
Local inference is the most literal version of that argument I know. A box you bought is NRE. A cloud token is COGS, every single time, forever. Well, actually it’s CAPEX but let’s not get into the details of accounting. It’s the same thing for the point I’m making.
So I went and looked at the number from my results that actually made me sit up — and it isn’t a comparison between the two machines at all. Same box. Same task. Same model, same settings, same frozen prompt. Best run: 1.7 million input tokens. Worst run: 78.7 million.
Forty-six times, on identical inputs, decided entirely by whether the agent had a good day.
On hardware you already own, that’s wall clock on a machine that was sitting there anyway. On a metered endpoint, that’s a bill that swings 46× for the identical deliverable, and nothing warns you which run you got until the invoice shows up.
Which reframes the whole comparison. A box that’s 1.71× slower per token is a completely different proposition when its tokens are free at the margin. Slow and owned beats fast and metered at some exchange rate.
But “free at the margin” is doing a lot of work in that sentence, and I don’t want to slide past it. Wall clock is not free. Moving the meter off dollars doesn’t delete the cost — it changes the currency. Now you’re paying in whether anyone actually reaches for the thing instead of tabbing back to the cloud. Those are the bills local inference sends you, and they’re denominated in exactly the thing these two machines differ on.
So the speed question doesn’t go away when you own the hardware. It’s the only question left. Which is the entire reason for everything below.
Two Boxes, One Question
The question isn’t “which one wins a synthetic benchmark.” I don’t care. The question is: which one actually takes a specified project from requirements to a tested binary — unattended?
And I want to be precise about that word, because waiting is the least of it. Sitting there watching tokens crawl out is a minor irritation. The thing that actually wrecks the afternoon is an agent that doesn’t finish: it either fails somewhere in the middle, or it stops and quietly waits on a question while you’re off doing something else. Either way you come back an hour later to a process that has been parked since about four minutes after you walked away.
That’s the real currency. Not tokens per second. Whether you can kick it off, leave, and come back to a result instead of a prompt.
| ASUS Ascent GX10 | HP ZBook Ultra G1a 14" | |
|---|---|---|
| Silicon | NVIDIA GB10 Grace Blackwell | AMD Ryzen AI MAX+ PRO 395 |
| Accelerator | Integrated Blackwell | Radeon 8060S, 40 CU, gfx1151 |
| Backend | CUDA 13.0 | ROCm 7.2.1 |
| Memory | 128 GB unified | 128 GB unified, 92.5 GiB GPU-visible |
| Form factor | Desk appliance, mains powered | Fits in a backpack |
Here’s why the answer isn’t obvious, and why this was worth doing properly instead of just eyeballing it.
Both boxes serve bit-identical weights. Same model (qwen3-coder-next, 79.7B total parameters with about 3B active — 10 of 512 experts), same digest, same quantization, same 131072 context, same KV cache type, same Ollama version. So the honest prior on output quality is no difference at all. If one box reliably wrote better code than the other, that wouldn’t be capability — it would be a numerical divergence between the CUDA and ROCm kernels. That’s a bug report, not a verdict.
The expected difference was speed. And specifically, whether that speed difference compounds across the dozens of turns an agentic build actually consumes.
Spoiler: it compounds. Not in the way I predicted.
First, a Big Fat Caveat
This is my first serious attempt at building a structured comparison like this, and I want to be honest about what that means: the premises are quite likely flawed in ways I haven’t spotted yet.
I’m a software guy who has been shipping systems for a long time. I am not a benchmarking researcher. I built this harness from scratch over a few days, and along the way I found five separate bugs in my own test rig that would each have silently corrupted the results.
Five that I found before I started writing. There was a sixth. It wasn’t in the harness — it was in me, in how I read my own output, and it’s the reason this post has a Finding Three that says the opposite of what I first drafted.
The worst one is instructive: I had pinned the model’s context window to 131072 on the GX10 but not on the ZBook. Both machines advertise 262144 while actually serving 131072, so my agent was over-packing every request to the laptop by 2× — an uncontrolled asymmetry in the exact variable I was trying to measure. I caught it by accident. If I hadn’t, I’d have published a much more dramatic and completely wrong number.
In fairness to my own process, the other four surfaced because I built this thing spec-first using Superpowers — a frozen design spec, an implementation plan derived from it, and a code review at every step, with the review diffs committed alongside the code. That discipline is the only reason a harness written in a few days has its own paper trail of what it was supposed to do, which is exactly what you need to notice that it isn’t doing that. Superpowers has changed how I work at least as much as the agent has, and it’s getting its own post too.
So read everything below as “this is what one guy measured on his own gear with a harness he wrote himself,” not as a review. Most of it is out there — requirements, grading suite, harness, and a findings doc that keeps my retracted conclusions on the record next to the corrected ones — precisely so somebody can tell me where I’m wrong. (The raw trial data is not, yet; see the caveats near the end.)
When the Anecdotes and the Data Agree
There’s a Bezos line I keep coming back to:
“The thing I have noticed is when the anecdotes and the data disagree, the anecdotes are usually right. There’s something wrong with the way you are measuring it.”
I love that quote because it inverts the usual engineering reflex. We’re trained to trust the instrument over the human. Bezos is saying: no, when your careful measurement contradicts what people are actually telling you they experience, your measurement is the suspect.
Here’s what I originally wrote in this spot: “In my case, the anecdotes and the data agree.” The laptop feels slower. The laptop feels like it thrashes. The desk box feels like it gets to the point. Everything I measured lined up with what my hands had been telling me for weeks, and I treated that as a green light.
That was exactly backwards, and it’s worth sitting with why.
Bezos’s rule tells you what to do when the instrument and the hands disagree. It says nothing about what to do when they agree — and agreement is not validation. If you already believe something and your measurement confirms it, you have learned almost nothing about your measurement. You’ve just found a number that gives you permission to stop looking.
I stopped looking. Finding Three is what was sitting underneath.
How I Tested It
Five decisions did most of the work here.
One agent, one frozen configuration, every single trial. Every trial on both machines was driven by oh-my-pi — omp (omp.sh). Same binary, same version, and one frozen configuration overlay loaded before the host routing on all 27 runs.
I want to dwell on that config for a second, because it’s doing more work than “same settings” suggests. What it mostly does is turn things off: memories, autolearn, hindsight mental models, context promotion, branch summaries, recap, prewalk, advisor, web search. Every one of those is a feature I want in daily use, and every one of them would have quietly wrecked this experiment — because an agent that remembers trial N-1 is not giving you 27 independent trials, it’s giving you one trial and 26 echoes. Fresh throwaway profile per trial, so nothing leaks forward. The loop guards stayed on deliberately, since a repetition loop is a real failure mode I wanted to measure rather than prevent.
If the agent’s configuration had drifted between the two hosts, none of the numbers in this post would mean anything — I’d be comparing prompts, not machines. omp is my new shiny toy and much, much better than claude code for local inference, and it deserves its own post rather than a paragraph. It’s coming.
Freeze the task. The agent implements pngdec, a small Go CLI that reports PNG chunk structure as JSON — with specified exit codes, partial output on malformed input, and byte-offset error messages. It’s written down in a requirements document that never changed between trials. Small enough to finish, precise enough to score by machine.
Freeze the grader, and never show it to the agent. Correctness is decided by 32 acceptance test cases I wrote from the requirements. Every trial’s binary gets run against that identical suite. This is the piece I’d tell anyone else to do first, because a metric that depends on me reading diffs cannot be compared across dozens of trials. I’d just be grading my own mood.
Hold everything else constant. Same driver machine, same agent binary, same model digest, same Ollama version, same server tuning, same prompt, fresh git workspace per trial. A preflight check verifies all of it before every batch and aborts on any mismatch. And critically: neither box drives its own trials. A third machine runs the agent for both, so neither gains from local socket latency or loses CPU to the agent process.
Two things escaped that list, and both of them bit me. I changed the KV-cache setting partway through as a diagnostic, and — much worse — I ran different batches under different wall-clock timeouts and then pooled the results. My preflight script enforced a dozen variables I’d thought to name in advance and had nothing at all to say about the one I was changing by hand on the command line. Finding Three is what that cost.
Treat cloud contamination as fatal. A single turn silently served by Ollama Cloud would score the wrong machine entirely. Model fallback is disabled and every trial’s turns get verified against the intended provider. Any contaminated trial is voided, not trusted.
You do use a fresh workspace per trial, right? I didn’t, at first. Don’t be me.
Finding One: The Code Is Indistinguishable
| host | trials | perfect 32/32 | median score |
|---|---|---|---|
| GX10 (GB10) | 19 | 3 | 0.84 |
| ZBook (Strix) | 8 | 2 | 0.83 |
One point of a percent apart, which at n=19 and n=8 is the same thing as identical. Both hosts span the entire range, worst run to best.
And I have to qualify my own scale here, because I found a floor in it while checking these numbers. Seven of my 32 cases are the suite’s own pure-Go fixture tests — chunk layout, CRC helpers, round-tripping — and they never actually execute the agent’s binary. They pass no matter what. So the worst possible score isn’t 0/32, it’s 7/32, and three trials sat exactly there: two ZBook, one GX10, all three having failed to produce a working build at all. Those aren’t bad code. They’re no code, wearing a 22% like a participation trophy.
Drop the free cases and the honest scale is 25 graded cases, running 0/25 to 25/25. Medians become 0.80 for the GX10 against 0.78 for the ZBook. Same null result, slightly less flattering denominator.
(Restrict to the control configuration only — dropping a four-trial diagnostic batch I ran at a different KV-cache setting and later reverted — and it goes 0.84 for the GX10 against 0.91 for the ZBook, with the laptop ahead. Also noise, n=6. I’m showing you both cuts because the conclusion doesn’t move and I’d rather you see me not cherry-pick the one that flatters my thesis.)
This is a null result, and it’s the whole foundation. The two boxes serve bit-identical weights, so “no quality difference” was the honest prior going in. Getting it is what makes the speed numbers trustworthy — if quality had diverged, I’d have had a kernel bug to chase instead of a comparison to report.
And here’s the fun part: I did prove the two backends compute different numbers. Identical frozen prompt, 1003 tokens, greedy decoding, each host perfectly reproducible with itself — and the first generated token differs. The GB10 says " P" (heading toward “PAX sparse file headers”), Strix says " GNU" (heading toward “GNU sparse file headers”). Both are plausible continuations.
Worth being precise about what’s guaranteed here and what isn’t. Floating-point non-associativity and different reduction orders guarantee the two backends compute slightly different numbers — cross-backend bit-identity isn’t an achievable goal and never was. They do not guarantee a different token. That only happens when the top two candidates are close enough that a rounding difference outranks the gap between them. Here they were that close. Most of the time they aren’t, which is why this shows up at character one and then essentially never matters again.
Real divergence. Zero measurable effect on final quality. Sometimes the interesting bug is the one that doesn’t matter.
Finding Two: 1.71× on Decode — and Why That Number Surprised Me
Decode rate, scraped from both servers’ logs during the real workload rather than from a synthetic probe. About ten thousand samples:
| host | samples | min | median | max |
|---|---|---|---|---|
| GX10 | 4385 | 34.6 | 44.5 | 61.1 |
| ZBook | 6085 | 19.2 | 26.0 | 46.9 |
26 tokens/sec sustained on an 80B model, from a 14" laptop, on battery-capable silicon. Stop and appreciate that for a second. That number would have been science fiction one year ago. Sparse activation is why it’s possible at all — only ~3B of those 80B parameters fire per token.
But 1.71× bugged me, and here’s why. Decode is memory-bandwidth-bound, and on paper these two machines have nearly the same memory bus: the GB10 is around 273 GB/s and Strix Halo is around 256 GB/s. That’s about 7% apart. Yet I measured decode 71% apart.
If decode were purely bandwidth-bound, that gap should have been small. It wasn’t. Something is eating the difference.
My money is on the software stack: CUDA’s kernels for this shape of work have had years of tuning that ROCm on gfx1151 simply hasn’t had yet. Strix Halo is bleeding-edge silicon; I’ve already written about what that costs you on Linux.
But I want to be loud about the fact that this is a hypothesis I did not measure, and it isn’t the only candidate. Those bus numbers are theoretical peak, and nobody hits theoretical peak — the two platforms may be much further apart on effective bandwidth than on the spec sheet. This is also a mixture-of-experts model, so every token pays for expert routing and gather/scatter across 10 of 512 experts, which is a memory access pattern that rewards a mature kernel and punishes a naive one. Add quantized matmul efficiency, cache behavior, flash-attention implementation differences, CPU–GPU sync overhead, and the thermal envelope of a 14" chassis versus a mains-powered appliance, and there are at least six ways to land at 71% that have nothing to do with my pet theory.
I measured none of them. If someone wants to prove me wrong here, please do. I’d genuinely rather learn than be right.
All of that is decode. There’s a second half to inference, and for agentic work it may matter more.
Generating text happens in two distinct phases. Prefill is the model reading — it ingests the entire prompt and does the math across all of it before emitting a single character. Every input token can be crunched in parallel, so prefill is compute-bound: a big pile of matrix multiplication where raw arithmetic throughput wins. Decode is the model writing — one token at a time, each one depending on the one before it, so it can’t be parallelized and instead has to stream the weights through memory for every single token. That’s why decode is bandwidth-bound and prefill isn’t.
Which explains how the same two machines can be 1.71× apart on one phase and nearly 4× apart on the other. Blackwell has vastly more arithmetic to bring to bear. It just can’t use most of it when the bottleneck is the memory bus.
Prefill is what you actually experience as time to first token — the dead air after you hit enter, before anything shows up on screen.
And here’s why that lands harder on an agent than on a chat. Every turn re-sends the whole conversation. The agent reads a file, runs a build, pastes in the error output, edits, runs it again — context grows monotonically all day long. A good server reuses the cached work for the part of the prefix that hasn’t changed, which helps a lot. But anything that rewrites the context throws that away, and when you’re filling a 131k window, compaction eventually does exactly that. Then you pay full price again. Now multiply by a few hundred turns — which is what a median trial on either machine actually costs.
Decode speed sets how fast you watch it type. Prefill speed sets how long you wait before it starts — over and over and over.
Prefill favors the GB10 much more heavily: 2.8× at 32k context, 3.8× at 90k. Those cells have n=1, so don’t quote them as settled. But time-to-first-token at 90k context was 68 seconds on the GB10 versus 256 seconds on the ZBook. Four minutes of nothing, before the first character. That one you feel in your chest.
Finding Three: I Measured My Stopwatch, Not the Machine
Here’s what I originally had in this slot, and I’m leaving it up because the way it falls apart is more useful than the claim ever was.
Restricting to trials where the agent actually stopped on its own — the only runs with a meaningful end-to-end time, since a capped run’s duration is just the cap:
| host | n | wall minutes | turns |
|---|---|---|---|
| GX10 | 7 | 10.6 – 60.9, median 29.2 | 47 – 165, median 86 |
| ZBook | 1 | 182.3 | 1567 |
Six times the wall clock. Eighteen times the turns, against a decode ratio of only 1.71×. I wrote a whole section on it. The gap is not throughput, the gap is thrashing. The laptop wanders its way to the same answer. I even had a theory: the logit divergence from Finding One flips near-ties, and those flips route Strix down longer, loopier paths.
Great story. Now look at what that table is actually comparing.
That’s the GX10’s seven cleanest runs — the ones that finished — against the ZBook’s single completion. I filtered on the outcome and then drew a conclusion about the outcome. That is not a subtle statistical sin. It’s the first one in the book, and I walked straight into it with a smile.
Here is the same data with the filter taken off, across every trial on the control configuration:
| GX10 | ZBook | |
|---|---|---|
| median turns, all trials | 347 (n=17) | 276 (n=6) |
| median turns, runs that hit the cap | 893 (n=10) | 126 (n=5) |
| median input tokens per trial | 24.9M | 18.5M |
The laptop uses fewer turns. It uses fewer tokens. And when the GX10 fails, it burns roughly seven times the turns the ZBook does — 989, 1032, 1087, 937 on runs that never declared themselves done. One of those, at 1087 turns, had already written a perfect 32/32 and just kept going.
So much for wandering.
Then it got worse
So I went looking for why the ZBook never terminated, and found the answer in a table I had written myself two days earlier.
I did not run both machines under the same time cap.
| cap | GX10 | ZBook |
|---|---|---|
| 70 min | 2 of 11 | no trials |
| 90 min | 5 of 6 | 0 of 5 |
| 180 min | no trials | 1 of 1 |
Every completion number I had — “GX10 41%,” “ZBook 1 of 6” — was three different cap policies stirred together. Neither figure describes a condition both machines were actually tested under. Eleven of the GX10’s seventeen ran at 70 minutes, a policy my own findings doc formally retracts a page and a half later.
And a fixed wall-clock cap is not a neutral instrument when the entire premise of the experiment is that one machine is 1.71× slower. The GX10’s successful runs took 10.6 to 61 minutes. Scale that by decode alone and the laptop’s equivalent range is 18 to 105 minutes; scale it by something between decode and the ~4× prefill gap — which is what an agentic run actually pays, turn after turn — and the top of that range runs well past two hours. Either way, a 90-minute cap lands inside the laptop’s distribution. It doesn’t measure the machine. It amputates the slow half of it and reports the stump.
I already knew this. I had proven it on the GX10 — tightening the cap from 90 minutes to 70 dropped its completion rate from 5/6 to 2/11, and I wrote “a shorter time cap manufactures failures” and I meant it. Then I applied one cap across two machines of different speeds and never noticed I had done the identical thing in a different direction.
The one time the ZBook got a cap sized to its own speed, it finished. 182 minutes, a perfect 32/32 — a score matched by only three of the nineteen GX10 runs in the whole set. My findings doc puts it flatly: "‘g1a cannot complete this task’ was never supported and is now falsified." I wrote that sentence myself. It did not make it into the first draft of this post.
One more asterisk on that run, because honesty is the whole point of this section: it is the same trial I use as a cautionary tale below. It exited claiming success while its own tests were failing, and its last six tool calls were byte-identical. It wrote perfect code by my grader’s standards and declared victory mid-loop by its own. Both of those are true about the same 182 minutes.
What actually survives
At the one cap both machines were given — 90 minutes — the GX10 finished 5 of 6 and the ZBook finished 0 of 5. That result is real, and it’s sharper than the muddled 41% I originally led with.
But read it for what it is. On a task the GB10 typically clears in half an hour, a machine 1.71× slower does not reliably clear it in ninety minutes. That’s a statement about speed. It’s the same 1.71× from Finding Two plus the ~4× prefill gap, showing up as a cliff instead of a slope, because a deadline turns a continuous variable into a binary one.
Which is, I’ll grant, still the thing you care about. “It’s slower” and “it doesn’t finish before I give up on it” are the same fact at different magnifications. But the mechanism matters, because the mechanism tells you what to do about it. If the laptop were genuinely thrashing, you’d need a better backend and you’d be waiting on AMD. It isn’t. It needs more clock, and I need to stop timing it like it’s the desk box.
The part that holds up regardless
Both of these machines are bad at finishing unattended. That’s the headline I should have led with, and it isn’t about AMD versus NVIDIA at all.
Every trial that hit the cap had already built a working tree — source, tests, a Makefile, a compiled binary. It then got stuck during verification. And here I should be precise, because I wasn’t the first time: they didn’t all get stuck the same way. Sorting the failures by what the last six tool calls look like gives three modes.
| mode | signature | seen in |
|---|---|---|
| Repetition loop | 1 distinct command in the last 6 | ~3 of 7 ZBook; both GX10 f16 runs |
| A-B-A-B cycle | 2 commands alternating | ~3 of 7 ZBook |
| Non-convergence | 4–5 distinct commands, tests still failing, clock runs out | 1 of 7 ZBook; the GX10’s one q8_0 failure |
Only the first is the tidy “re-issued the same command forever” story I told originally. The second evades my loop guard completely. The third isn’t a loop at all — it’s an agent doing genuinely new work and simply not getting there in time, which is the mode you cannot distinguish from “needed a bigger cap” without, well, a bigger cap.
What they share is that none of them stopped. That is not a machine being slow. That’s a machine that is confused, or unfinished, and has no way to say either one out loud.
A timeout is not a separate failure mode. It’s an agent asking for help in the only language it has left. Approvals were off, so it couldn’t stop and ask me anything, which means “needs a human” and “spins until the clock kills it” are the same event wearing different clothes.
And on the GX10 — the box I’m going to end up recommending — that happened in 9 of 11 runs at the 70-minute cap. Neither of these machines is something you can currently start and walk away from on a task this size. The GX10 is just less bad at it, and “less bad” is doing heavy lifting in that sentence.
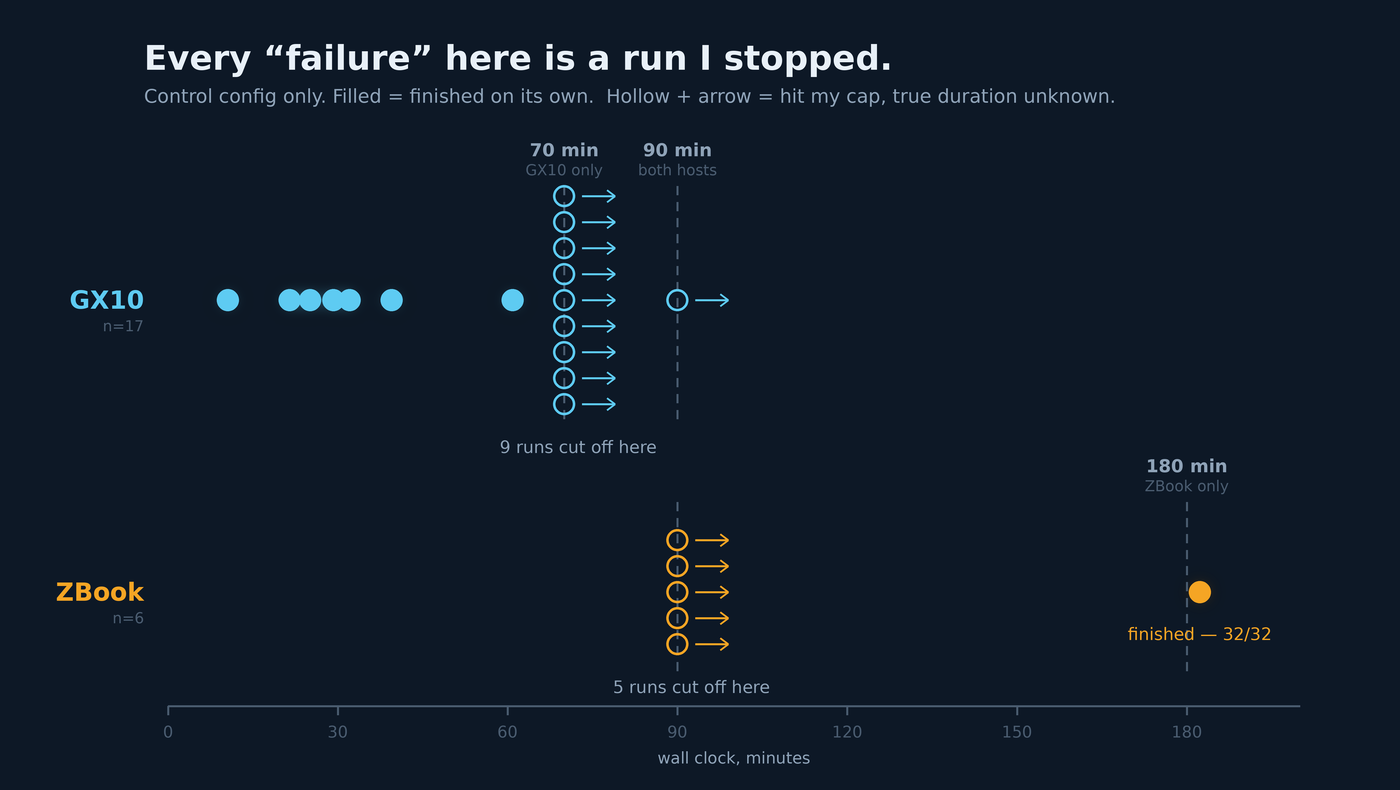
Every run I logged as a failure is a run I stopped. The 70-minute cap only ever ran on the GX10; the 180-minute cap only ever ran on the ZBook. One column is a comparison. The rest is bookkeeping.
What Else I Got Wrong (Twice More)
Finding Three was the worst one. These two are older, smaller, and I’d already caught them — but they’re the reason I went back and caught the big one.
My first correctness metric checked that the agent exited cleanly with a successful build. It never checked whether the tests passed.
Read alone, that metric said one box works and the other never does. Then I scored the frozen suite and found out how wrong I was, in both directions at once:
- One ZBook run recorded as a failure (hit the time cap) had already written perfect 32/32 code. It just never declared itself done.
- One recorded as a success had failing tests and was repeating the same command when it stopped. It declared victory mid-loop. That one is the 182-minute run from Finding Three — my best ZBook result and my worst-behaved trial are the same 1567 turns.
Termination is not capability. I fell into that trap, published the wrong conclusion internally, corrected it, then fell into a cousin of it in Finding Three anyway. My findings doc keeps the wrong version on the record right next to the right one, because I clearly cannot be trusted not to reach for the easy metric again.
One more that cost me real time:
Higher precision made both machines worse. This one needs a definition first, because the KV cache is one of those things everybody running local models has an opinion about and not everybody can define.
To generate the next token, a model attends to every token that came before it. Recomputing all of that from scratch on each new token would be brutal, so it keeps the intermediate key and value vectors for every token it has already processed and reuses them. That’s the KV cache. It is pure speed — without it, generation slows to a crawl as the conversation grows — and you pay for it in memory that grows right along with your context. At the 131072 context I served, mine measured about 1.6 GB, sitting alongside 48 GiB of weights. On a box where memory is the whole product, that’s not a rounding error.
The knob is how precisely you store those vectors. q8_0 quantizes them to 8 bits and halves the footprint. f16 keeps full 16-bit floats — twice the memory, no rounding. And that rounding is the interesting part: quantizing the KV cache puts approximation error directly inside the attention mechanism, which is exactly the kind of thing you’d suspect if one of your two machines were behaving strangely. Hence the experiment.
So I switched from q8_0 to f16, expecting the ZBook’s looping to ease. Both hosts went to 0/4, with tighter loops. Higher precision producing worse behavior is the opposite of what a quantization-error story predicts — which is a good sign the story was wrong. My unproven hunch is that the flip silently changed which attention kernel gets used rather than merely raising precision, since quantized KV generally requires flash attention while f16 can take a different path. Reverted, theory dead, lesson kept.
Where the Premises Are Probably Flawed
Let me do this to myself before someone else does.
There is no frontier baseline here, and that’s the biggest hole in the whole thing. This test compares two machines running the same open-weight model. It says exactly nothing about whether that model is good enough to displace a frontier cloud model on real work. Both boxes scored around 0.84 against my own 32-case suite — but “these two hosts are equally good” and “this is good enough to bet real work on” are entirely different claims, and I’ve only tested the first one. The second is the question that actually matters, and it’s next on my list. Don’t let me, or anyone, wave this post at it.
My harness could only observe one of the two ways a run stalls — though I think they’re mostly the same thing. Trials ran non-interactively with approvals off, because an unattended benchmark cannot answer prompts. So every failure I measured is the spins until the clock runs out kind, never the stops and asks you something kind. As argued in Finding Three, I believe a spin is largely a request for help with nowhere to go, which is what makes the timeout rate usable as a proxy for “needed a human.”
But it is a rough proxy and I don’t want to oversell it. It cannot separate a run that wanted one clarifying answer from a run that was simply broken, from a run that just needed nine more minutes — which, per Finding Three, turns out to be a much larger share than I assumed. Read any of my timeout rates as a loose estimate of how often a session needs you, not a measurement of it.
One model, one task. Everything above is qwen3-coder-next building one small Go CLI. I have no idea yet whether these results are a property of the machines or a property of this specific model on this specific shape of work. A second arm with a smaller model is planned for exactly that reason.
No seed control. A seed is the starting number for the random draw the model makes when it picks the next token from its candidates. Fix the seed and the same prompt yields the identical output every time; leave it unset and every run rolls fresh dice. It’s the difference between an experiment you can re-run and an experiment you can only average. My agent exposes temperature, top-p, top-k and repetition penalty — but no seed. So when a trial does something startling, I cannot re-run that trial to see it again; I can only run another one and hope. The whole comparison rests on per-host aggregates, not on any single run being repeatable.
Uneven n, and worse, uneven conditions. 19 trials on the GB10, 8 on the ZBook — and as Finding Three lays out, they weren’t run under a common time cap, a common KV-cache setting, or a common anything except the task and the grader. The quality null result is well-supported. Almost everything else in this post rests on the single 90-minute cell where both machines have more than one trial.
My grader has a floor, and one signal hides under it. As Finding One says, 7 of the 32 anchor cases never exec the binary, so the real scale is 25. Worth pulling out one thing that only becomes visible once you do: on the control configuration, 2 of 6 ZBook trials produced nothing that runs, against 1 of 17 on the GX10. That points the same direction my gut did — but on the build axis, not the wandering one, and at two events versus one it’s a coin flip dressed up as a trend (Fisher exact, p≈0.17). I’m listing it as something to watch in the next round, not as a result.
You can read my work but you can’t yet re-run it. Two things I found while checking these numbers, and they’re both on me. First, score.py was only walking one of my three results directories — 13 GX10 trials and 2 ZBook, not 19 and 8 — so the aggregates I’ve been quoting came from a manual pass rather than from the committed tool. Fixed now. Second and more annoying: the results/ tree is in my .gitignore, so the raw per-trial data isn’t in the public repo at all. The requirements, the grading suite, the harness and the findings doc are all there and that’s most of what you’d want to argue with. The 27 trials themselves are on my disk. Publishing them is on the list right behind re-running the scorer.
Thermals aren’t instrumented. The ZBook is a 14" laptop. It may well be throttling under three hours of sustained inference. I didn’t measure it. That’s a real hole, and it’s one that would make the laptop look unfairly bad in exactly the long-running scenario where I measured it looking worst.
Ollama isn’t the fast path. I used the same serving stack on both machines because that was the only honest way to hold the variable constant. It’s not necessarily the best stack for either one.
One guy, one harness, one week. Five bugs found in my own rig, plus the sixth in Finding Three that no amount of harness discipline would have caught because it was an analysis error, not a code error. Assume seven.
The Anecdotes
Now the unscientific part.
I have been living with both of these machines. On the ZBook, an agentic session feels like it’s grinding. On the GX10, sessions feel like they converge. I reach for the desk box without thinking about it now, and I noticed that habit forming well before I had a single number to justify it.
I still trust that feeling. What I no longer trust is my explanation for it.
I was certain the grinding was the laptop wandering — running the same command over and over, going nowhere. The data says the laptop runs fewer commands than the desk box does. What I was actually feeling was 26 tokens a second and a four-minute wait before the first character showed up, and my brain quietly wrote a story about thrashing, because thrashing is a more interesting story than “slow.”
That’s the thing about anecdotes that Bezos’s version leaves out. They’re reliable about the experience and terrible about the cause. Mine correctly told me which machine to reach for. They were dead wrong about why — and they were wrong in the exact direction that flattered my pet theory about ROCm.
What I Take Away
Remember that I am punting on the frontier-comparison question for now.
Local inference for agentic coding is real enough to plan around, and the appliance is the right shape. A shared, mains-powered box that does one job is the unit that makes sense. Not an inference server per person — you’d pay laptop prices for a fraction of the throughput and spend the difference waiting.
Don’t buy the laptop for this. Buy it because it’s a superb development machine that happens to be able to do this in a pinch, on a plane, with no network. That’s a genuinely valuable fallback. It is not a capacity plan.
Whatever you cap, that’s what you’ll end up measuring. This is the one I’d hand to anyone building their own eval, and it cost me a week to learn. A wall-clock timeout is not a neutral referee — it is a filter, and it discriminates against exactly the slower system you were trying to characterize. If your two candidates differ in speed, a shared deadline converts that speed difference into a completion difference and then hands it back to you looking like a capability difference. Cap on something the system controls — turns, tokens, repeated commands, failed validations — or run every arm at several caps and report the curve. I did neither.
Wasted turns are a cost line, not a latency annoyance. Point agentic work at a metered endpoint and you’re exposed to a failure mode where the bill scales with the model’s confusion — and nothing tells you until the invoice arrives. That needs a meter and a cap on it, which is exactly the metering exercise I argued for in May.
Note that this has nothing to do with which box you buy. It’s the same machine, same task, same settings, swinging from 1.7M input tokens to 78.7M depending on the day. Both of my machines do it. Your cloud endpoint will do it too, and it will charge you for the privilege.
And I need better alerting — that one’s on me, not the hardware. The entire premise of unattended agentic work is that you leave. Which means the instant a run needs a human — a question, a hard failure, a loop it can’t claw out of — something ought to come find me, instead of waiting politely in a terminal I stopped looking at forty minutes ago. I don’t have that today, and running this benchmark made it embarrassingly obvious that I should: I lost real hours to sessions that had been parked long before I wandered back. No amount of tokens per second fixes that.
The encouraging part is that most of the signal is dead simple. A stuck agent repeats itself, and in the majority of my failures the last six tool calls collapse to one or two distinct commands. You don’t need a model to notice that. You need a few lines of string comparison and something that can fire a push notification. And my agent does ship a loop guard: on one trial it fired exactly once against 1222 tool calls, and across the whole set it never once caught a two-command A-B-A-B cycle. So the detector exists and is nowhere near aggressive enough.
The mode that isn’t simple is non-convergence — varied commands, real work, no progress. String comparison won’t catch that one. You’d want to watch whether the acceptance-test count is moving, or whether any file has changed in the last N turns. That’s a harder detector and it’s the one that would have saved me the most, because it’s the mode a timeout can’t distinguish from “almost done.”
And a timeout is a terrible substitute for it. That’s the lesson of Finding Three arriving from the other direction: because my only backstop was a clock, I couldn’t tell “this agent is stuck” from “this agent needed nine more minutes,” and I spent a week drawing conclusions about silicon from a number that was mostly about my own --max-time flag. Detect the loop and you don’t need to guess. Cap the clock and guessing is all you get.
Spotting the spin is easy. Someone has a solution to make it shout, but do I want to subscribe to yet another tool? No. That’s a notification problem, not an inference problem, and it’s going on my build list.
Important: this does not get you out of the cloud. For hard reasoning, long context, and the work that actually matters, the frontier models are still the frontier models. What local buys you is the long tail — and per the NRE argument, moving the long tail off the meter is where the compounding savings live. “Local where possible, cloud for the heavy lifting” is still where I think this lands. I just have more evidence for it than I did in May — and one number, that 46× swing between an agent’s best day and its worst on identical inputs, that makes the case better than anything I could have argued.
Untested: which is better for the designing? Foundation or local? More testing!
Conclusion: My Favorite Notebook PC, Ever
Let me be completely clear about something, because the numbers above could easily read as a hit piece and they are not.
The HP ZBook Ultra G1a is my favorite notebook PC ever. Ever. Not “of the last few years.” Ever. It is a 14-inch machine that weighs nothing, goes in a backpack without a thought, and holds 128 GB of unified memory. As a workhorse development machine it is astonishing — it compiles, it runs containers, it drives my whole workflow, and it does it in a chassis I forget I’m carrying. I have owned a lot of laptops. This is the one. It’s a company machine and I’d buy one with my own money tomorrow, which is about the highest compliment I know how to pay a piece of hardware.
I’ve not used my MacBookPro in months. Time to wipe it and turn it back into IT for re-use.
The HP is not perfect and I won’t pretend otherwise. The built-in camera does not work. At all. The AMD ISP4 camera driver stack isn’t upstream yet, and worse, loading it wedges an I²C controller and takes the trackpad down with it — which I spent an afternoon chasing to ground and wrote up here. My fix is to blacklist the whole camera stack, which is lossless only because the camera was never working anyway. I use an external webcam.
But I learned: as an inference server, it does not live up to my hopes. I wanted the ZBook to be the whole stack — agent and model, in one bag, on a plane, no network. It can do that. It produces code just as good as the appliance does, and given a clock sized to its own speed it will finish the job.
It’s just going to make me wait. 1.71× on every token, close to 4× before the first one appears, and on a task the desk box clears in half an hour that difference is the difference between coming back to a result and coming back to a timer. That’s a duller verdict than “the AMD stack is thrashing,” and I was disappointed to give up the more dramatic one. It also happens to be what the data says.
So the division of labor in my shop is now settled, and it isn’t the one I wanted:
- The GX10 serves the model. It’s a mains-powered appliance that sits there and does one job well.
- The ZBook does everything else, and it’s the best machine I’ve ever done “everything else” on.
That’s a good outcome, and a cheaper one than I expected. It’s just not the outcome I was rooting for — and I think being honest about which of those two things is which is most of what makes a test like this worth running at all.
One last thing, and it’s the reason this post is a third longer than it was two days ago. A reader went through my numbers and pushed on how much weight the conclusions could carry. They were right, and chasing that down is what turned up the cap confound — a mistake I’d already documented, in my own words, in my own findings doc, and then failed to apply to my own post. That’s the whole value of publishing your raw results: somebody reads them more carefully than you did.
So: if you’ve run something similar on Strix Halo — especially if you’ve got ROCm tuned better than I do, or you’ve instrumented thermals, or you just want to tell me my statistics are still wrong — I would genuinely love to hear it. The repo is here, retracted conclusions and all. Drop me a note on LinkedIn.